What is the first thing you do when you get new data? Most likely, you would want to see it. Not just the numbers, but its relationship to other data in 3D. Likewise, when you have to explain how you built a geological model you would want to show how you did it. In GEOREKA, we provide visual feedback at every step. Imported data is displayed immediately, workflows are set up in a visual way. All this provides fast visual feedback to verify that what you are modelling is correct. Check below to find out how.
Visually validate your data
Check 3D relationships
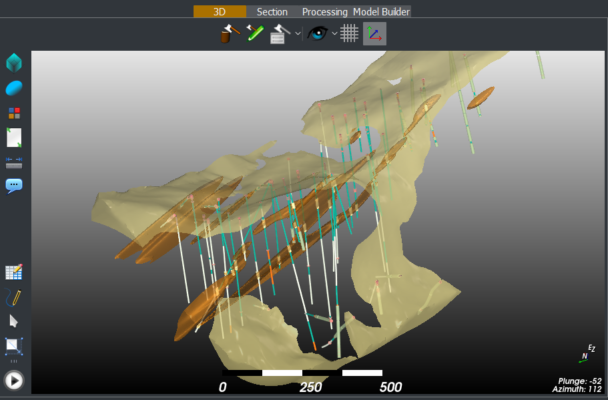
Since the very start of GEOREKA (see about us) we have endeavoured to produce high-end 3D visualization. Not for the ‘wow-factor’, but because visualization forms such an important part of quality control. At each modelling step, visual inspection is crucial. Good visualization is therefore a must and a fundamental feature of GEOREKA.
Examples visualizing various types of data
2D plots for additional insights
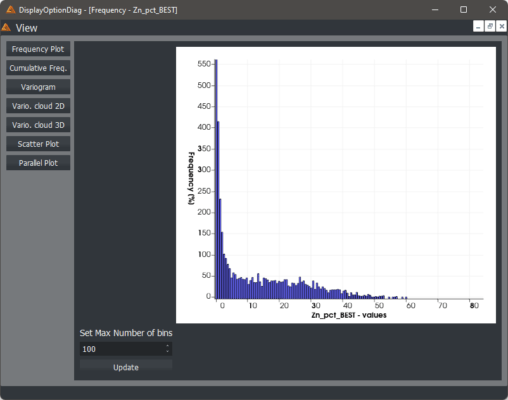
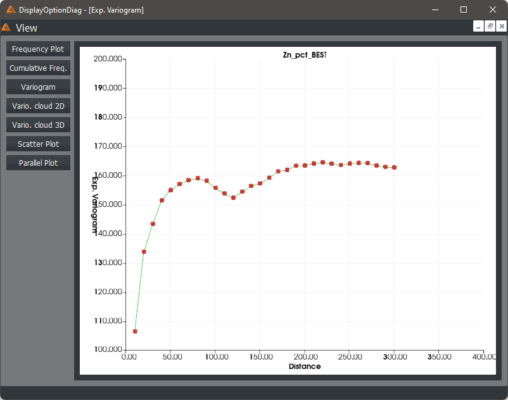
Addtionally, any point set can be analysed in detail with 2D plots as well. Traditional ones like scatter plots, frequency plots, and variograms allow for standard inspection. In addition, some novel plots are also available as part of our ongoing quest to provide new ways to analyse data. A good example is the multi-element parallel plot where relationships between multiple elements can be quickly visualized.
Interactive selections
Most plots will have an interactive interface that can be used to select points in these plots to highlight them in 3D, or even to use only those selected points for processing.
Frequency plots, variograms & more
Preview implicit models
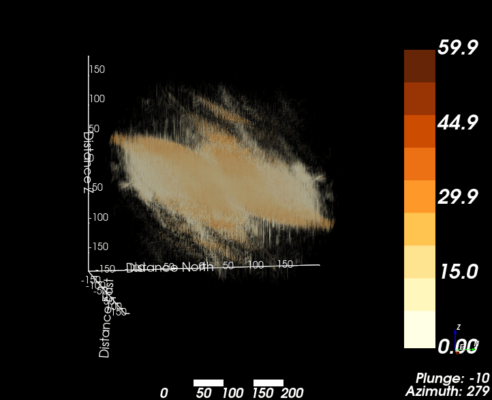
Using novel rendering techniques allows us to preview any implicit function quickly and dynamically before committing to a certain triangle resolution or modelling output. To display implicit functions (https://www.georeka.com/signed-distance-functions-beyond-implicit-modelling/) we use a technique called ray tracing. Each of these functions represents a domain, i.e. a volume. By previewing them using ray tracing techniques, a domain and its anisotropy settings can be determined before a final model is created.
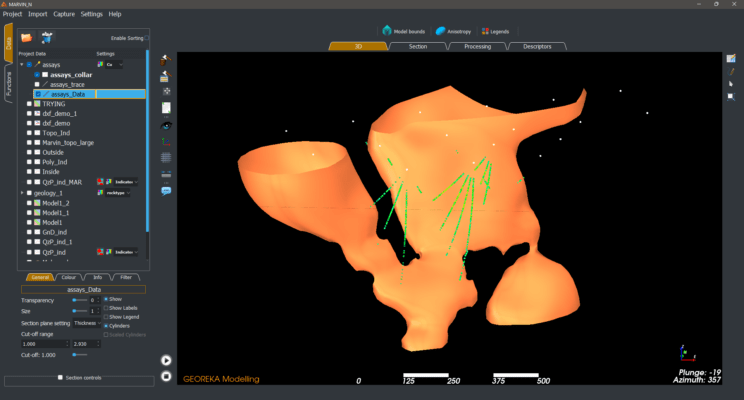
Example of a domain rendered using Raytracing.
Combine point clouds with other modelling
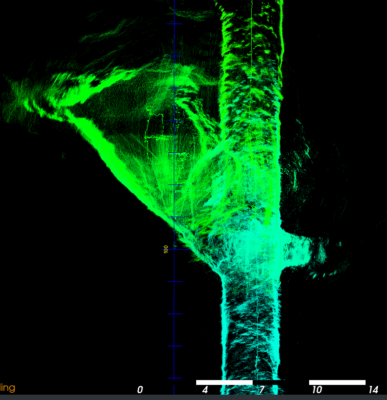
Our contribution in several large research projects has enabled us to develop tools for handling 100’s of millions of points on a good laptop. Lidar scans, photogrammetry or other techniques that produce high-density point clouds can be used seamlessly with any other data. Moreover, some very powerful tools have been added to model these point clouds, especially for tunnels and caves.
Visually set up, inspect and re-run workflows
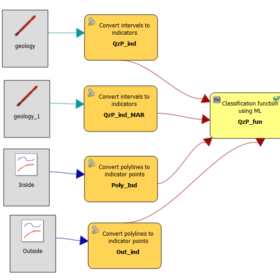
Re-usable, flexible workflows form the core of our modelling engine. GEOREKA is built on flexibility. This means there are no rigid workflows one must follow. Instead, users can create their own as and how they are needed.
Since each workflow is set up visually, it also means a screenshot can be used to explain them to third parties. Moreover, all the tools for building a workflow are in one place, making it easier to look for particular items.
Fast 3D selections for finer details
Not only common selections of interval data down drillholes are possible, data from any point set can be visually selected. Selections are a powerful means to selectively process sub-set of a larger data set. But, most of, they are dynamically adjustable and updated to update an existing modelling workflow that allows interactive modelling with full transparency.
